What you should know about the Nikkei 225 index of Japan


What you should know about the Nikkei 225 index of Japan
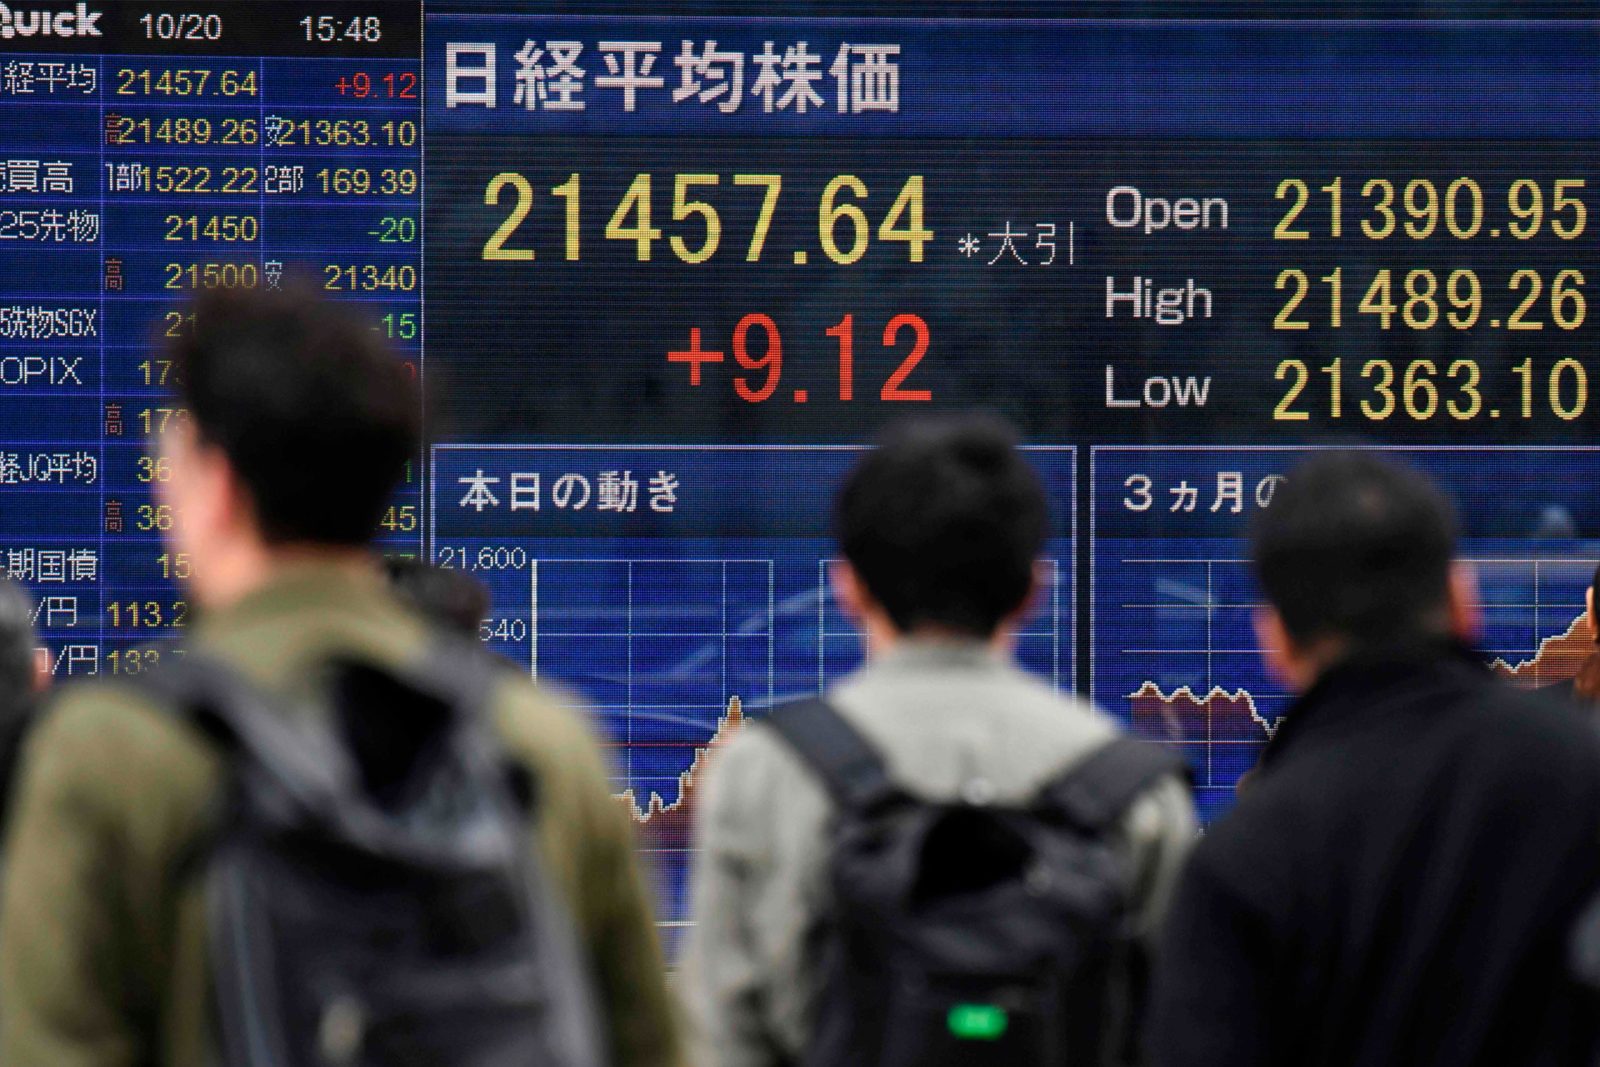
The Nikkei 225 serves as the primary gauge for assessing the Tokyo Stock Exchange’s performance. Comprising 225 domestic stocks chosen from the most liquid shares within the exchange’s premier section, where the most prominent blue-chip companies are listed. This index adopts a price-weighted methodology, which implies that stocks with higher prices wield greater influence over the index’s performance due to their higher weightings. As of November 2017, the market capitalization of the index stood at ¥400 trillion.
Data Compilation
The index’s data is compiled by Nikkei, the publisher of Japan’s leading financial newspaper, and it undergoes calculation adjustments every five seconds during regulated trading hours.Periodic Reviews
Nikkei conducts an annual review of the index’s composition every October to ensure its representativeness. Stocks with robust market liquidity may replace those with lower liquidity, with a focus on maintaining sector balance. However, changes to the index may also occur outside of the regular review schedule, triggered by events like company mergers or bankruptcies. In the October 2017 review, two alterations were made to the Nikkei 225 index, with Recruit Holdings and Japan Post Holdings replacing Hokuetsu Kishu Paper and Meidensha. In August 2017, following Toshiba’s relegation to the second section of the stock exchange, Seiko Epson replaced it in the Nikkei 225. The index’s divisor, a key component of its calculation, is adjusted when new stocks are introduced to ensure the index’s consistency.Largest Companies
Currently, the Nikkei 225 is most heavily influenced by Fast Retailing, the parent company of Uniqlo, accounting for 6.79% of the index’s weight. The top five companies by weighting are:- Fast Retailing
- Softbank Group
- Fanuc
- Tokyo Electron
- KDDI
Sector Composition
The Nikkei 225 comprises six primary categories, consolidated from the 36 Nikkei industrial classifications. In descending order of size, they are:- Technology
- Consumer Goods
- Materials
- Capital Goods/Others
- Transportation and Utilities
- Financials
Historical Highs and Lows
The Nikkei 225 was introduced on September 7, 1950, with its value retrospectively calculated to May 16, 1949. Its peak closing value of 38,915.87 was achieved on December 29, 1989, during the Japanese asset price bubble. In contrast, its lowest value of 7,054.98 was recorded on March 10, 2009. In October 2017, the index established a record by closing higher for 16 consecutive days, reaching a 21-year high of 21,805.17 on October 24.Notable Events
The Nikkei 225 experienced significant fluctuations in its history, with both peaks and troughs. The most substantial single-day drop occurred on October 20, 1987, known as “Black Monday,” when the index plummeted by nearly 15%. Another substantial decline of nearly 11% transpired on March 15, 2011, following the Fukushima nuclear disaster. Conversely, the index’s most substantial single-day rise, exceeding 14%, transpired on October 14, 2008, in the wake of global efforts to stabilize struggling banks.Historical Background
The Tokyo Stock Exchange traces its origins to 1878, making it the second oldest stock exchange in Asia. It adopted its current name in 1949 and currently ranks as the fourth largest stock exchange globally by market capitalization. The index of leading shares was initially administered by the Tokyo Stock Exchange but transitioned to Nikkei’s management in July 1970. During the period between May 1985 and May 1995, Nikkei was licensed to use the Dow name, leading to alternative names for the index such as the Nikkei Dow-Jones Stock Price Average and the TSE Dow. In April 2000, the index underwent changes in its methodology for selecting constituents.Derivatives and Trading
The Nikkei 225, as the primary Japanese index, serves as a fundamental reference for various financial instruments, including options and futures, funds, exchange-traded funds, and structured products. It is also available for trading as a contract for difference (CFD).Volatility
The Nikkei 225’s volatility index, which gauges the rate of price fluctuations within the index, currently hovers around 17. It experienced one of its most volatile days on June 24, 2016, the day following the UK’s Brexit referendum, when the Nikkei 225 tumbled by nearly 8%, and the volatility index surged to 40.71.Get back to Seikum News 🤓


